Analog Devices Inc., Elliott Wave Technical Analysis
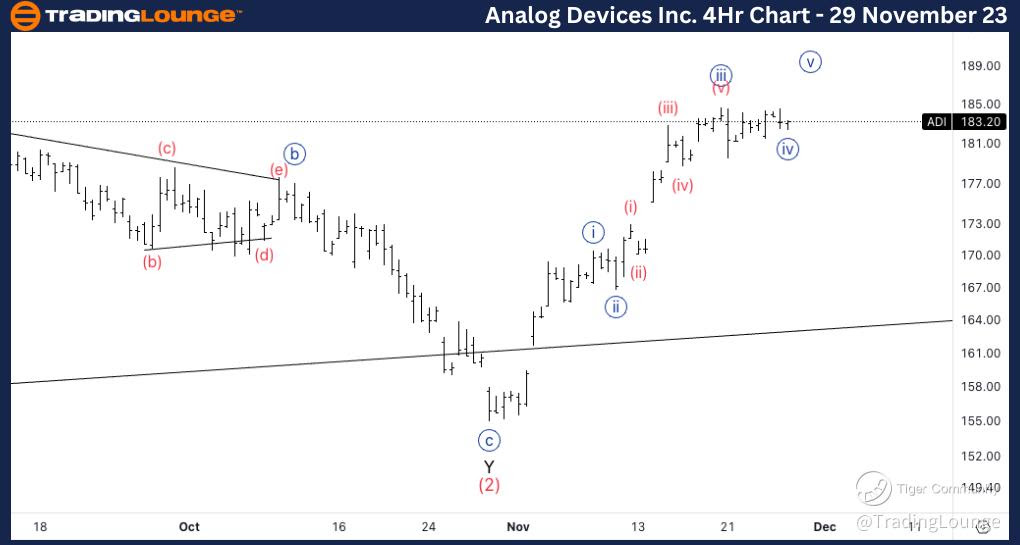
Analog Devices Inc., (ADI:NASDAQ): 4h Chart 29 November 23
ADI Stock Market Analysis: We have been looking for upside on Analog Devices as 183$ as been acting as tested support for some days now. Looking for continuation higher into Minor Group 2 and potentially all the way up into 200$.
ADI Elliott Wave Count: Wave {iv} of 1.
ADI Technical Indicators: Below 20EMA.
ADI Trading Strategy: Looking for longs into wave {v}.
TradingLounge Analyst: Alessio Barretta
Source: Tradinglounge.com get trial here!

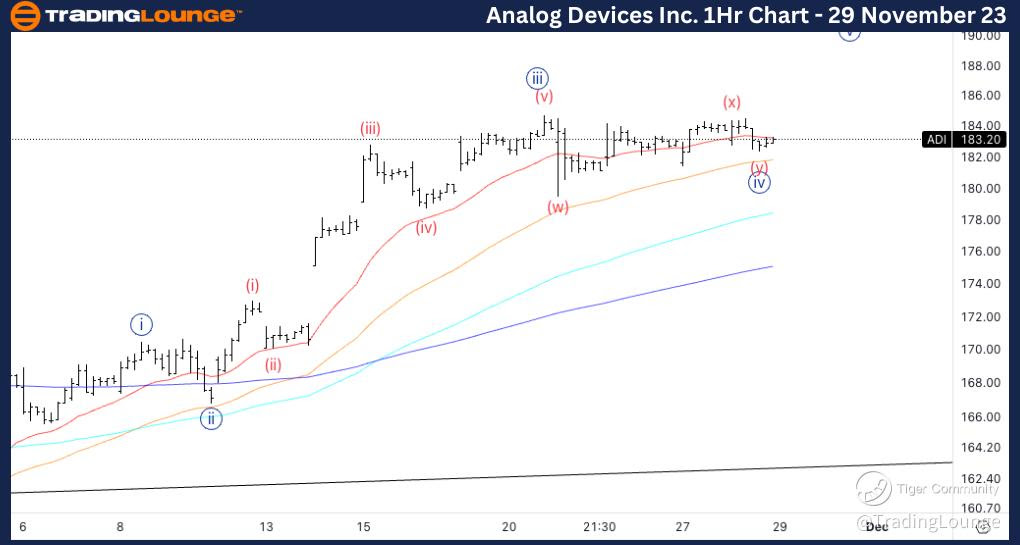
Analog Devices Inc., ADI: 1-hour Chart 29 November 23
Analog Devices Inc., Elliott Wave Technical Analysis
ADI Stock Market Analysis: Looking for some sort of complex correction into wave {iv} as we are moving sideways, alternating with the corresponding wave {ii}.
ADI Elliott Wave count: Wave (y) of {iv}.
ADI Technical Indicators: Above all averages.
ADI Trading Strategy: Looking for longs into wave {v}.
